DOOp
The DAOSPEC Output Optimiser pipeline (DOOp) was built to allow for efficient and convenient equivalent widths measurements in batches of hundreds of spectra. It is made of a series of BASH scripts that work as a wrapper for the FORTRAN code DAOSPEC (Stetson & Pancino, 2008) and uses IRAF to fix automatically some of the parameters that are usually set by hand when using DAOSPEC. This not only ensures more repeatable results, but allows to batch-process quantities of spectra that would be impossible to deal with by hand.
DOOp was originally built to deal with the large quantity of UVES and GIRAFFE spectra produced by the Gaia-ESO Survey, but just like DAOSPEC it can be used on any high resolution and high signal-to-noise ratio spectrum binned on a linear wavelength scale.
Download:
DOOp V2.0.2
Last updated: 2014-03-26
NB: for the moment, no line list is provided
Quick start
Download and extract the DOOp tar file. In this example, the directory used will be /home/user/doop/. Open the option file pipe.opt and set WORK_DIR=/home/user/doop/ and STUFF_DIR=/home/user/doop/STUFF/.
In order for DOOp to work properly, you need to have IRAF installed, and a login.cl file present in the /home/user/doop/ directory (it can be created with the command mkiraf). DOOp also needs the daospec command to be in your path (not set as an alias).
The list of spectra to process has to be given in the file inputlist.dat (by default, but you can change this name in the option file pipe.opt). For instance, for two spectra, the content must look like this:
/home/user/spectra/arcturusU.fits 30 9 0 0 0 U
/home/user/spectra/arcturusL.fits 30 9 0 0 0 U
The first column is the full path of the spectrum. The second is the order of the Legendre polynomial to be used for the continuum fitting (here 30). The third column is the first guess of the FWHM in these spectra, in pixels. The fourth column indicates if this value has to be kept fixed (1) or if the program will optimise it (0). The fifth and sixth columns are the first guess of the radial velocity and residual core flux, respectively. If they are unknown, leave use the default value of 0 (to actually set it to zero, use a small value like 0.01). The last column should be U in the general case. If set to G, the pipeline will perform an extra run in which it will used a fixed FWHM, equal to the median FWHM of the spectra. This can be useful when working on short spectral ranges or with lower resolution spectra, where defining the FWHM is less simple.
Now everything is good to go, execute DOOp.sh to run the measurements. The output products will be present in the directory /home/user/spectra/: for each measured spectrum, a normalised spectrum (*N.fits), fitted spectrum (*F.fits) and continuum (*C.fits), as well as a file *.daospec that lists all the detected lines and those that were matched with the line list. DOOp provides additional files: *.iron and *.moog that contain all the iron lines in the range 5-120mA, and all atomic lines in the same range, directly in the right format for MOOG. It also produces *.in files in the format for an analysis with GALA. If these files are not needed, the user can simply comment out the lines calling tomoog.sh and togala.sh in DOOp.sh
Finally, if the user wishes to use their own line list, DOOp performs the same. The line list has to be in the right format for DAOSPEC, with the first 8 characters of each line being the laboratory wavelength of the spectral lines. The *.daospec and *.fits output will be exactly what you are used to if you use DAOSPEC. However, the tomoog.sh and togala.sh scripts use a specific format and will probably not work with your custom line list (nothing will crash, but their output files will not be usable).
DOOp also creates several files in /home/user/doop/, keeping a log of the action of each module. You can also visually control the fit performed by DAOSPEC, by executing the Python script:
python visualcheck.py inputlist.dat.
It displays the original and normalised spectrum, and the corresponding fit. To see the next spectrum in your list, press ENTER in the prompt. To go back to the previous spectrum, type "b" in the prompt and ENTER. This device uses the widely used Python library Matplotlib, which makes the plots scalable and zoomable interactively.
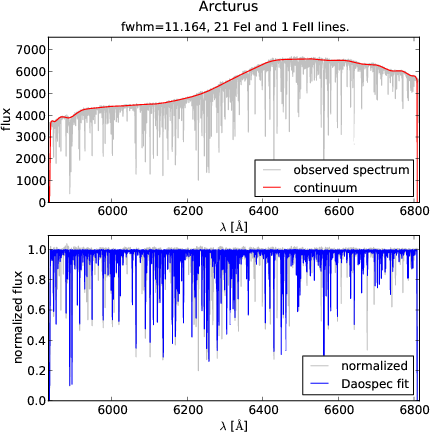
Checking the result of running DOOp on a UVES-POP spectrum of Arcturus. Top panel: original spectrum and continuum. Bottom panel: normalised and fitted spectrum. Matplotlib allows for interactive zooming for an efficient inspection.
A more in-depth description of each module can be found in the README file provided with DOOp and in the refereed publication about DOOp.
Contact
For doubts or questions, write to:
tristan.cantat-AT-oapd.inaf.it
or
paolo.donati4-AT-unibo.it